


Key News
Headlines are speaking to Asia’s rebound, highlighted by Japan’s very strong move along with Hong Kong, Mainland China, India, the Philippines, and Australia, all of which rebounded significantly overnight. However, Indonesia reopened lower by -7.90%, Taiwan was down by -4.02%, Thailand was down by -4.50%, Singapore was down by -2.01%, and Vietnam fell -6.43%.
China’s government sent the cavalry in to support the stock market and was starting to feel a bit like George Custer. It was interesting to hear that the US Treasury Secretary bashed the US stock market because only rich people held it versus the Chinese government literally buying the stock market. Let that one sink in and think about the long-run repercussions. The National Team, entities that invest on behalf of the Chinese government, such as their sovereign wealth fund, National Social Security Fund, and state-owned enterprise (SOE) insurance companies, did not attempt to hide their activity, but actually promoted and published it. As an FYI, this is very rare. Hong Kong and Mainland China had very strong days on high volumes, though the rallies were slightly different, as Hong Kong was led higher by growth stocks while Mainland China was led higher by mega and large capitalization stocks. Both markets did ease off intra-day highs in the afternoon.
Announcements With Positive Market Impacts:
- PBOC will support Central Huijin Investment Company’s effort to buy ETFs.
- National Social Security Fund announced it is buying stocks.
- NFRA increased insurance companies’ upper limit of equity holding.
- Chentong Holdings increased holdings in stocks and ETFs.
- China Reform Holdings Corporation’s holdings in SOE companies will be supported by borrowing RMB 80 billion to fund buybacks.
- Sinopec announced a buyback of RMB 2-3 billion in A & H shares.
- CATL announced a buyback of RMB 4-8 billion.
- BOE announced a buyback of RMB 1.5 billion.
- PetroChina announced a buyback of RMB 2.8-5.6 billion in A & H shares.
The five National Team ETFs we track saw today’s volume surge versus their 30-day averages and inflow yesterday in US dollars:
- 5.853 million shares versus the 30-day average of 1.197 million and +$2.38 billion inflow
- 4.037 million shares versus the 30-day average of 451,000 and +$1.249 billion inflow
- 3.556 million shares versus the 30-day average of 851,000 and +$360 million inflow
- 3.574 million shares versus the 30-day average of 235,000 and +$1.138 billion inflow
- 2.997 million shares versus the 30-day average of 245,000 and +$173 million inflow.
Southbound Stock Connect inflow from Mainland China into Hong Kong stocks and ETFs today was a healthy net $3.04 billion as Alibaba and Tencent saw very large net inflows.
Hong Kong was led higher by growth stocks, including the internet sector and automobile stocks, on strong Q1 sales announced by BYD. Household appliances and machinery were high, while banks were lower. Mainland China stocks were led by mega-capitalization bank stocks, energy, Kweichow Moutai, telecommunication, and coal, though Apple’s supplier ecosystem was off, and semiconductor stocks were mixed.
Premier Li spoke with the EU President von der Leyen. The Ministry of Commerce’s comments remained tough on US tariffs. Why? Read below!
The origin of China Last Night was driven by our first significant investor, who, after visiting China over several decades, no longer felt he could trust Western media as a reliable source of understanding what was happening in China’s economy and capital markets. Working in finance, he was a numbers guy, so the exaggeration, hyperbole, clickbait, and apocalyptic headlines not backed by data were a factor in him asking me to write him an email about “what happened in China last night”. I’ve noticed a pick-up in the media on relying on data, which is a great trend.
We discussed yesterday the fantastic Wall Street Journal article on General Motors and Ford (hyped tariff beneficiaries who will be hurt by tariffs for multiple reasons). So, a simple question to ask today would be, isn’t China folding like a chair on the US tariff threat? As we discussed yesterday, one reason is the US tariffs only look at goods while ignoring the reality the US is the largest exporter of services and the revenues generated by US companies who manufacture and sell in China aren’t considered US exports. Besides national pride, isn’t China completely dependent on exports? A simple question would be: What percentage of China’s GDP is driven by export-driven manufacturing?
- China’s 2024 GDP was RMB 134.9084 trillion
- Value of China’s Exports RMB 15.4338 trillion
- That represents 11.44% of China’s GDP
There are lessons from studying China’s economy, capital markets, and government policy for the last twelve-plus years that are relevant today for the US economy and stock market. China’s primary source of savings has been real estate, with minimal exposure to the stock market. According to Reuters on March 13, 2025, the US Federal Reserve reported that at year-end 2024, the stock market, especially after a sixteen-year bull market, is “the biggest component of US household net worth, rose about $300 billion to $56 trillion in value, while household real estate, the second-biggest component, fell about $400 billion to $48.1 trillion.” Therefore, the recent decline in the US stock market will have a similar knock-on effect on US consumer confidence and, therefore, retail sales. This is why I highly doubt the “$600 billion of tariff revenue”, which is really a tax paid by US consumers, is unlikely to come to fruition as the lack of US retail sales is apt to curtail the tariff revenue. Just as we’ve seen a significant pivot in China to address the housing crisis, the question is how much stock market pain can DC take. Remember, Caesar wasn’t brought down by his enemies but by his friends, as the real economic pain has not been felt at all. This is a long-winded way of saying the sides will talk.
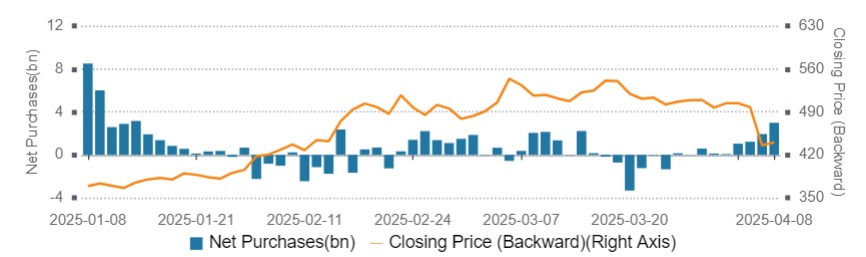
Tencent Price Chart and Net Inflow/Outflow from Southbound Stock Connect:
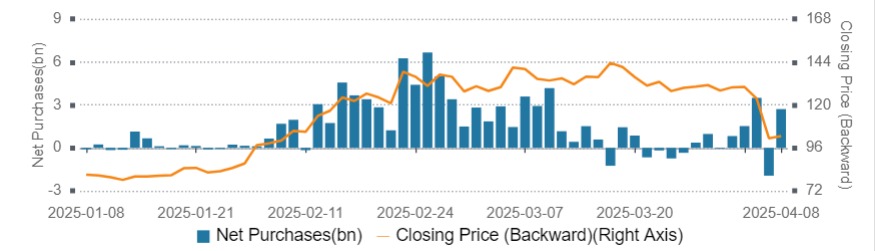
Alibaba Price Chart and Net Inflow/Outflow from Southbound Stock Connect:
The Hang Seng and Hang Seng Tech indexes gained +1.51% and +3.79%, respectively, on volume that was down -30.24% from yesterday, which is 252% of the 1-year average. 416 stocks advanced, while 78 declined. Main Board short turnover decreased by -25.37% from yesterday, which is 324% of the 1-year average, as 20% of turnover was short turnover (Hong Kong short turnover includes ETF short volume, which is driven by market makers’ ETF hedging). Growth and large capitalization stocks outperformed value and small capitalization stocks. All sectors were positive, led by technology, up +5.24%; consumer staples, up +3.87%; and materials, up +3.72%. The top sub-sectors were construction materials, consumer services, and machinery, while industry conglomerates and REITs were the worst. Southbound Stock Connect volumes were 5x pre-stimulus levels as Mainland investors bought $3.041 billion of Hong Kong stocks and ETFs, led by Tencent and Alibaba, which were very large net buys; Meituan was a large net buy, CNOOC, SMIC, and Kuaishou were large/moderate net buys, Xiaomi was small net buy, and Wuxi Biologics was a small net sell.
Shanghai, Shenzhen, and the STAR Board gained +1.58%, +0.81%, and +1.72%, respectively, on volume that was up +2.38% from yesterday, which is 135% of the 1-year average. 2,843 stocks advanced, while 2,237 declined. Value, dividends, and large capitalization stocks outperformed growth, momentum, and small capitalization stocks. Technology was the only negative sector, down -1.95%, while real estate gained +3.94%, energy gained +3.52%, and consumer staples gained +3.00%. The top sub-sectors were agriculture, retail, and food, while motorcycle, auto parts, and leisure products were the worst. Northbound Stock Connect volumes were 2X average. CNY and the Asia dollar index fell versus the US dollar. Treasury bonds fell. Copper fell, and steel fell.
Last Night’s Performance
| Country/Index | Ticker | 1-Day Change |
|---|---|---|
| China (Hong Kong) | HSI Index | 1.5% |
| Hang Seng Tech | HSTECH Index | 3.8% |
| Hong Kong Turnover | HKTurn Index | -30.2% |
| HK Short Sale Turnover | HKSST Index | -25.4% |
| Short Turnover as a % of HK Turnovr | N/A | 19.6% |
| Southbound Stock Connect Net Buy/Sell (US $ Millions) | N/A | 0 |
| China (Shanghai) | SHCOMP Index | 1.6% |
| China (Shenzhen) | SZCOMP Index | 0.8% |
| China (STAR Board) | Star50 Index | 1.7% |
| Mainland Turnover | .chturn Index | 2.4% |
| Nouthbound Stock Connect Net Buy/Sell (US $ Millions) | N/A | Not Available |
| Jing Daily China Global Luxury Index | CHINALUX Index | 2% |
| Japan | NKY Index | 6% |
| India | SENSEX Index | 1.5% |
| Indonesia | JCI Index | -7.9% |
| Malaysia | FBMKLCI Index | 0% |
| Pakistan | KSE100 Index | 0.5% |
| Philippines | PCOMP Index | 3.2% |
| South Korea | KOSPI Index | 0.3% |
| Taiwan | TWSE Index | -4% |
| Thailand | SET Index | -4.5% |
| Singapore | STI Index | -2% |
| Australia | AS51 Index | 2.3% |
| Vietnam | VNINDEX Index | -6.4% |
| MSCI China All Shares Index | # of Stocks | Average 1-Day Change (%) |
|---|---|---|
| Hong Kong Listed | 151 | 2.46 |
| Communication Services | 9 | 1.81 |
| Consumer Discretionary | 28 | 3.35 |
| Consumer Staples | 13 | 3.87 |
| Energy | 7 | 2.88 |
| Financials | 23 | 0.46 |
| Health Care | 13 | 2.87 |
| Industrials | 20 | 3.14 |
| Information Technology | 10 | 5.24 |
| Materials | 10 | 3.73 |
| Real Estate | 6 | 1.56 |
| Utilities | 12 | 1.52 |
| Mainland China Listed | 404 | 1.23 |
| Communication Services | 6 | 2.52 |
| Consumer Discretionary | 31 | 1.32 |
| Consumer Staples | 24 | 3.01 |
| Energy | 13 | 3.53 |
| Financials | 64 | 1.36 |
| Health Care | 31 | 0.77 |
| Industrials | 64 | 2.33 |
| Information Technology | 91 | -1.95 |
| Materials | 58 | 0.82 |
| Real Estate | 6 | 3.95 |
| Utilities | 16 | 2.05 |
| US & Hong Kong Dually Listed | Ticker | 1-Day Change (%) |
|---|---|---|
| Tencent HK | 700 HK Equity | 1.1 |
| Alibaba HK | 9988 HK Equity | 1.2 |
| JD.com HK | 9618 HK Equity | 8.9 |
| NetEase HK | 9999 HK Equity | 7.5 |
| Yum China HK | 9987 HK Equity | 1 |
| Baozun HK | 9991 HK Equity | 14.3 |
| Baidu HK | 9888 HK Equity | 4.1 |
| Autohome HK | 2518 HK Equity | -2 |
| Bilibili HK | 9626 HK Equity | 4.5 |
| Trip.com HK | 9961 HK Equity | 5.7 |
| EDU HK | 9901 HK Equity | 2.3 |
| Xpeng HK | 9868 HK Equity | 3.6 |
| Weibo HK | 9898 HK Equity | 5.8 |
| Li Auto HK | 2015 HK Equity | 1.4 |
| Nio Auto HK | 9866 HK Equity | 5.5 |
| Zhihu HK | 2390 HK Equity | 2.6 |
| KE HK | 2423 HK Equity | 6.7 |
| Tencent Music Entertainment HK | 1698 HK Equity | 10.2 |
| Meituan HK | 3690 HK Equity | 4.7 |
| Hong Kong’s Most Heavily Traded by Value | 1-Day Change (%) |
|---|---|
| ALIBABA GROUP HOLDING LTD | 1.2 |
| TENCENT HOLDINGS LTD | 1.1 |
| XIAOMI CORP-CLASS B | 6.7 |
| MEITUAN-CLASS B | 4.7 |
| BYD CO LTD-H | 4.8 |
| SEMICONDUCTOR MANUFACTURING | 3.8 |
| JD.COM INC-CLASS A | 8.9 |
| CHINA CONSTRUCTION BANK-H | -1 |
| HSBC HOLDINGS PLC | -1 |
| HONG KONG EXCHANGES & CLEAR | 0.5 |
| Shanghai and Shenzhen’s Most Heavily Traded by Value | 1-Day Change (%) |
|---|---|
| KWEICHOW MOUTAI CO LTD-A | 3 |
| CONTEMPORARY AMPEREX TECHN-A | 1.8 |
| EAST MONEY INFORMATION CO-A | 1.9 |
| BYD CO LTD -A | 1.8 |
| LUXSHARE PRECISION INDUSTR-A | -9 |
| WUXI APPTEC CO LTD-A | -9.7 |
| CHINA YANGTZE POWER CO LTD-A | 2.5 |
| CHINA MERCHANTS BANK-A | 0.8 |
| ZIJIN MINING GROUP CO LTD-A | 3.5 |
| PING AN INSURANCE GROUP CO-A | 1.4 |
Last Night’s Exchange Rates, Prices, & Yields
- CNY per USD 7.33 versus 7.31 yesterday
- CNY per EUR 8.02 versus 8.01 yesterday
- Yield on 10-Year Government Bond 1.66% versus 1.63% yesterday
- Yield on 10-Year China Development Bank Bond 1.71% versus 1.67% yesterday
- Copper Price -1.18%
- Steel Price -0.25%
—
Originally Posted April 8, 2025 – National Team Cavalry Arrives
Author Positions as of 4/8/25 are KLIP, KBA, KALL, KCNY, KFYP, KCNY, KEMQ, BZUN, HSBC, KWEB, KHYB, LI US
Charts Source: KraneShares
Disclosure: KraneShares
Content on China Last Night is for informational purposes only and should not be construed as investment advice. This material represents an assessment of the market environment at a specific time and is not intended to be a forecast of future events or a guarantee of future results; material is as of the dates noted and is subject to change without notice. This information should not be relied upon by the reader as research or investment advice regarding the funds or any security in particular.
This material may not be suitable for all investors and is not intended to be an offer, or the solicitation of any offer, to buy or sell any securities. Investing involves risk, including possible loss of principal.
This material contains general information only and does not take into account an individual’s financial circumstances. This information should not be relied upon as a primary basis for an investment decision. Rather, an assessment should be made as to whether the information is appropriate in individual circumstances and consideration should be given to talking to a financial advisor before making an investment decision.
Forward-looking statements (including Krane’s opinions, expectations, beliefs, plans, objectives, assumptions, or projections regarding future events or future results) contained in this presentation are based on a variety of estimates and assumptions by Krane. These statements generally are identified by words such as “believes,” “expects,” “predicts,” “intends,” “projects,” “plans,” “estimates,” “aims,” “foresees,” “anticipates,” “targets,” “should,” “likely,” and similar expressions. These also include statements about the future, including what “will” happen, which reflect Krane’s current beliefs. These estimates and assumptions are inherently uncertain and are subject to numerous business, industry, market, regulatory, geo-political, competitive, and financial risks that are outside of Krane’s control. The inclusion of forward-looking statements herein should not be regarded as an indication that Krane considers forward-looking statements to be a reliable prediction of future events and forward-looking statements should not be relied upon as such. Neither Krane nor any of its representatives has made or makes any representation to any person regarding forward-looking statements and neither of them intends to update or otherwise revise such forward-looking statements to reflect circumstances existing after the date when made or to reflect the occurrence of future events, even in the event that any or all of the assumptions underlying such forward-looking statements are later shown to be in error. Any investment strategies discussed herein are as of the date of the writing of this presentation and may be changed, modified, or exited at any time without notice.
Disclosure: Interactive Brokers Third Party
Information posted on IBKR Campus that is provided by third-parties does NOT constitute a recommendation that you should contract for the services of that third party. Third-party participants who contribute to IBKR Campus are independent of Interactive Brokers and Interactive Brokers does not make any representations or warranties concerning the services offered, their past or future performance, or the accuracy of the information provided by the third party. Past performance is no guarantee of future results.
This material is from KraneShares and is being posted with its permission. The views expressed in this material are solely those of the author and/or KraneShares and Interactive Brokers is not endorsing or recommending any investment or trading discussed in the material. This material is not and should not be construed as an offer to buy or sell any security. It should not be construed as research or investment advice or a recommendation to buy, sell or hold any security or commodity. This material does not and is not intended to take into account the particular financial conditions, investment objectives or requirements of individual customers. Before acting on this material, you should consider whether it is suitable for your particular circumstances and, as necessary, seek professional advice.
Disclosure: ETFs
Any discussion or mention of an ETF is not to be construed as recommendation, promotion or solicitation. All investors should review and consider associated investment risks, charges and expenses of the investment company or fund prior to investing. Before acting on this material, you should consider whether it is suitable for your particular circumstances and, as necessary, seek professional advice.
Disclosure: Alternative Investments
Alternative investments can be highly illiquid, are speculative and may not be suitable for all investors. Investing in Alternative investments is only intended for experienced and sophisticated investors who have a high risk tolerance. Investors should carefully review and consider potential risks before investing. Significant risks may include but are not limited to the loss of all or a portion of an investment due to leverage; lack of liquidity; volatility of returns; restrictions on transferring of interests in a fund; lower diversification; complex tax structures; reduced regulation and higher fees.
Disclosure: Forex
There is a substantial risk of loss in foreign exchange trading. The settlement date of foreign exchange trades can vary due to time zone differences and bank holidays. When trading across foreign exchange markets, this may necessitate borrowing funds to settle foreign exchange trades. The interest rate on borrowed funds must be considered when computing the cost of trades across multiple markets.


")
")

Join The Conversation
For specific platform feedback and suggestions, please submit it directly to our team using these instructions.
If you have an account-specific question or concern, please reach out to Client Services.
We encourage you to look through our FAQs before posting. Your question may already be covered!